
Confusion matrix
| actual (yes) | actual (no) | |
|---|---|---|
| predict (yes) | TP | FP |
| predict (no) | FN | TN |
- True Positive (TP): what we predict Positive is really Positive.
- True Negative (FN): what we predict Negative is really Negative.
- False Negative (FN): what we predict Negative is actually Positive.
- False Positive (FP): what we predict Positive is actually Negative.
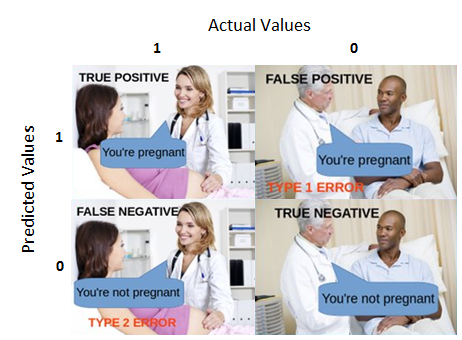
This guy is pregnant?
How to remember?
- True/False indicates what we predicted is right/wrong.
- Positive/Negative is what we predicted (yes or no).
Type I / Type II errors
- FP = Type I error = rejection of true null hypothesis = negative results are predicted wrongly = what we predict positive is actually negative.
- FN = Type II error = non-rejection of a false null hypothesis = positive results are predicted wrongly = what we predict negative are actually positive.
Why CM is important?
Give a general view about our model, "is it really good?" thanks to precision and recall!
Precision & Recall
| actual (yes) | actual (no) | ||
|---|---|---|---|
| predict (yes) | TP | FP | Precision |
| predict (no) | FN | TN | |
| Recall |
Precision: How many of our positive predictions are really true? (Check the accuracy of our positive predictions).
Recall: How many of positive results belong to our predictions? (Do we miss some negative predictions?)
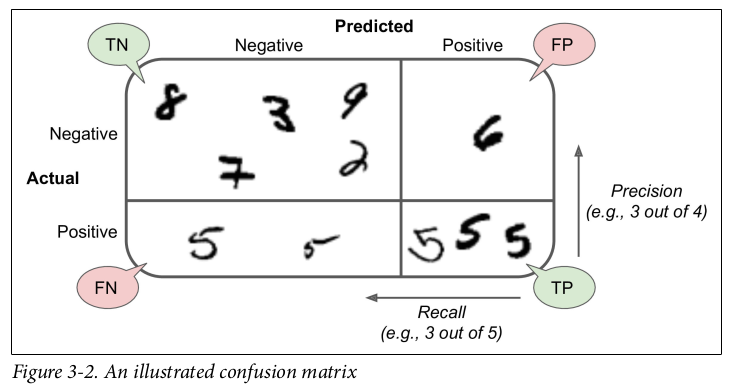
Recognizing number 5. Figure taken from this book.
When to use?
- Precision is importantly used when the "wrongly predicted yes" (FP) influences much (e.g. This email is spam? -- results yes but actually no and we lost important emails!).
- Recall (Sensitivity) is importantly used when the "wrongly predicted no" (FN) influences much (e.g. In the banking industry, this transaction is fraudulent? -- results no but actually yes and we lost money!).
Precision / Recall curve
With thresholds, we can use precision_recall_curve() to compute precision and recall for all possible thresholds,
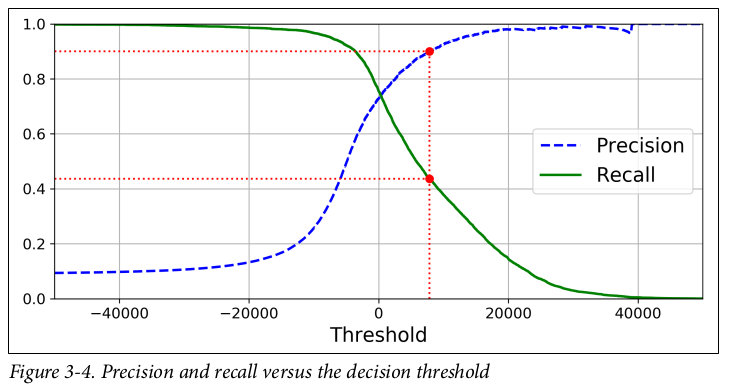
An example of Precision/Recall curve with many thresholds. Figure taken from this book.
Trace-off: Higher precision, lower recall and vice versa.
from sklearn.metrics import precision_recall_curve
precisions, recalls, thresholds = precision_recall_curve(y_train_5, y_scores)

plt.plot(thresholds, precisions[:-1], "b--", label="Precision")
plt.plot(thresholds, recalls[:-1], "g-", label="Recall")
plt.show()
F1-Score
High precision and low recall or vice versa? F1-Score gives us a balance between precision and recall.
F1-score depends on how we label the class "positive". This email is spam? is very different from This email is not spam?
When to use F1-Score?
- When you need a balance between precision and recall.
- When we have a "skewed class" problem (uneven class distribution, too many "yes" and very few "no", for example).
- One of precision and recall is improved but the other changes too much, then f1-score will be very small!
How to choose f1-score value?
Normally, and it gets the higher values, the better our model is.
- The best one (), both precision and recall get .
- One of precision and recall gets very small value (close to 0), is very small, our model is not good!
What if we prefer one of precision and recall than the other? We consider [ref]
is a special case of when :
- When precision is more important than recall, we choose (usually choose ).
- When recall is more important than precision, we choose (usually choose ).
Accuracy / Specificity
Accuracy: How accurate our predictions to the whole predictions?
Specificity: How many negative results belong to our predictions?
When to use?
- Accuaracy is used when we have symmetric datasets.
- Specificity is used when we care about TN values and don't want to make false alarms of the FP values (e.g. drug test).
The ROC Curve
- ROC = Receiver operating characteristic.
- A common tool used with binary classifier.
- Diffrent from precision/recall curve, ROC plots the true positive rate (recall) against the false positive rate (1 - specificity).
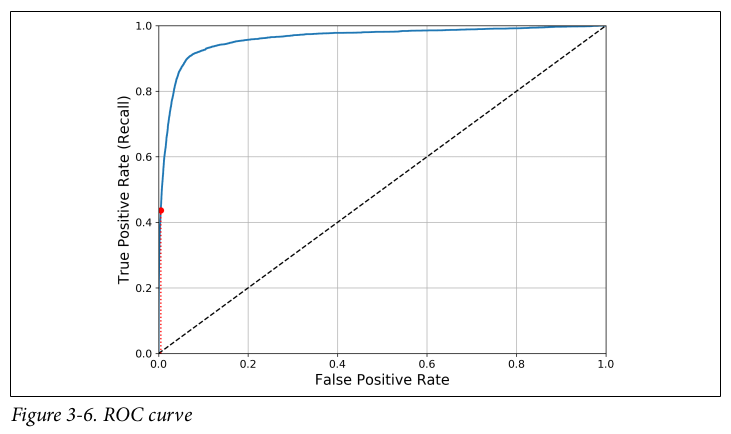
This ROC curve plots FPR vs TPR for all possible thresholds. The dotted line represents the ROC curve of a purely random classifier; a good classifier stays as far away from that lines as possible (toward the top-left corner). Figure taken from this book.
Trade-off: the higher recall, the more FPR (predict wrong) the classifier produces.
from sklearn.metrics import roc_curve
import matplotlib.pyplot as plt
%matplotlib inline

fpr, tpr, thresholds = roc_curve(y_test, y_pred_prob)
# create plot
plt.plot(fpr, tpr, label='ROC curve')
plt.plot([0, 1], [0, 1], 'k--') # Dashed diagonal
plt.show()
The AUC
- AUC = Area under the curve.
- Perfect classifier will have AUC = 1 (fix the rectangle).
- The purely random classifier (dotted line) will have AUC = 0.5.
Confusion Matrix & F1-Score with Scikit-learn
from sklearn.metrics import confusion_matrix
n_classes = target.shape[0]
confusion_matrix(y_true, y_pred, labels=range(n_classes))
Precision / Reacall / f1-score / support
from sklearn.metrics import classification_report
classification_report(y_test, y_pred)
References
- Classification: Precision and Recall - Google Developers, Machine Learning Crash Course.
- Classification: Check Your Understanding (Accuracy, Precision, Recall) - Google Developers, Machine Learning Crash Course.
- F-measure versus Accuracy - NLP blog.
- Accuracy, Precision, Recall or F1? - Koo Ping Shung, Towards Data Science.
- Dealing with Imbalanced data: undersampling, oversampling and proper cross-validation - Marco Altini.
- Accuracy, Recall, Precision, F-Score & Specificity, which to optimize on? - Salma Ghoneim, Towards Data Science.
💬 Comments