
The last modifications of this post were around 4 years ago, some information may be outdated!
In this note, I use df for DataFrame, s for Series.
Libraries
import pandas as pd # import pandas package
import numpy as np
Dataframe
dataquest_aio = 'https://raw.githubusercontent.com/dinhanhthi/dataquest-aio/master/step-2-data-analysis-and-visualization/'
dataset_url = dataquest_aio + 'course-4-data-cleaning-and-analysis/data/World_Happiness_2015.csv'
df = pd.read_csv(dataset_url) # read the data set
df.head()| Country | Region | Happiness Rank | Happiness Score | Standard Error | |
|---|---|---|---|---|---|
| 0 | Switzerland | Western Europe | 1 | 7.587 | 0.03411 |
| 1 | Iceland | Western Europe | 2 | 7.561 | 0.04884 |
| 2 | Denmark | Western Europe | 3 | 7.527 | 0.03328 |
| 3 | Norway | Western Europe | 4 | 7.522 | 0.03880 |
| 4 | Canada | North America | 5 | 7.427 | 0.03553 |
Group dataset using groupby()
Group df by column Region and then selct the column Western Europe,
df.groupby('Region').get_group('Western Europe') # returns a df| Country | Region | Happiness Rank | Happiness Score | Standard Error | |
|---|---|---|---|---|---|
| 0 | Switzerland | Western Europe | 1 | 7.587 | 0.03411 |
| 1 | Iceland | Western Europe | 2 | 7.561 | 0.04884 |
| 2 | Denmark | Western Europe | 3 | 7.527 | 0.03328 |
| 3 | Norway | Western Europe | 4 | 7.522 | 0.03880 |
| 5 | Finland | Western Europe | 6 | 7.406 | 0.03140 |
Select just the Happiness Score column and then find the mean,
df.groupby('Region')['Happiness Score'].mean()
# other methods: size, max, min, count
Region
Australia and New Zealand 7.285000
Central and Eastern Europe 5.332931
Eastern Asia 5.626167
Latin America and Caribbean 6.144682
Middle East and Northern Africa 5.406900
North America 7.273000
Southeastern Asia 5.317444
Southern Asia 4.580857
Sub-Saharan Africa 4.202800
Western Europe 6.689619
Name: Happiness Score, dtype: float64
Apply multiple/custom functions,
def max_min(group):
  return group.max() - group.min()

df.groupby(['Country', 'Region']).agg([np.mean, np.max, max_min]).head()| Happiness Rank | Happiness Score | ||||||
|---|---|---|---|---|---|---|---|
| mean | amax | max_min | mean | amax | max_min | ||
| Country | Region | ||||||
| Afghanistan | Southern Asia | 153 | 153 | 0 | 3.575 | 3.575 | 0.0 |
| Albania | Central Europe | 95 | 95 | 0 | 4.959 | 4.959 | 0.0 |
| Algeria | Middle Africa | 68 | 68 | 0 | 5.605 | 5.605 | 0.0 |
If you wanna apply different functions on different columns,
df.groupby(['Country', 'Region']).agg({
    'Happiness Rank': max_min,
    'Happiness Score': ['min', 'max'],
    'Standard Error': 'count'
}).head(3)| Happiness Rank | Happiness Score | |||
|---|---|---|---|---|
| max_min | min | max | ||
| Country | Region | |||
| Afghanistan | Southern Asia | 0 | 3.575 | 3.575 |
| Albania | Central Europe | 0 | 4.959 | 4.959 |
| Algeria | Middle Africa | 0 | 5.605 | 5.605 |
Or using apply and lambda function,
orders.groupby('shoes').price.apply(lambda x: np.min(x, 25)).reset_index()Group using pivot_table()
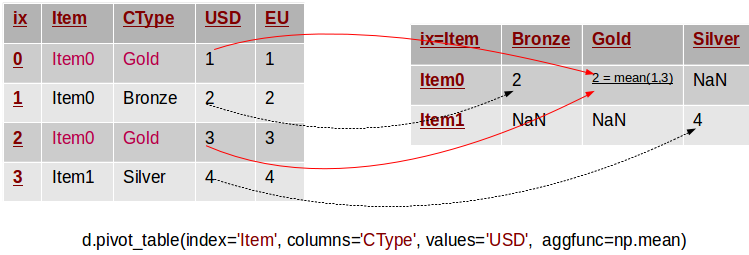
An example of pivotting by a single column[ref]
Group by Region (as an index) and choosing GDP and City columns,[ref]
df.pivot_table(values=['GDP', 'City'], index='Region') # returns df| Happiness Rank | Standard Error | |
|---|---|---|
| Region | ||
| Australia and New Zealand | 9.5 | 0.037270 |
| Central and Eastern Europe | 79.0 | 0.045208 |
| Eastern Asia | 64.5 | 0.037225 |
Apply some functions,
df.pivot_table(['GDP', 'City'], 'Region', aggfunc=[np.mean, np.max], margins=True)
# margins shows the "All" row| mean | amax | |||
|---|---|---|---|---|
| Happiness Rank | Standard Error | Happiness Rank | Standard Error | |
| Region | ||||
| Australia and New Zealand | 9.5 | 0.037270 | 10 | 0.04083 |
| Central and Eastern Europe | 79.0 | 0.045208 | 134 | 0.06913 |
| Eastern Asia | 64.5 | 0.037225 | 100 | 0.05051 |
Reorganizing df using pivot()
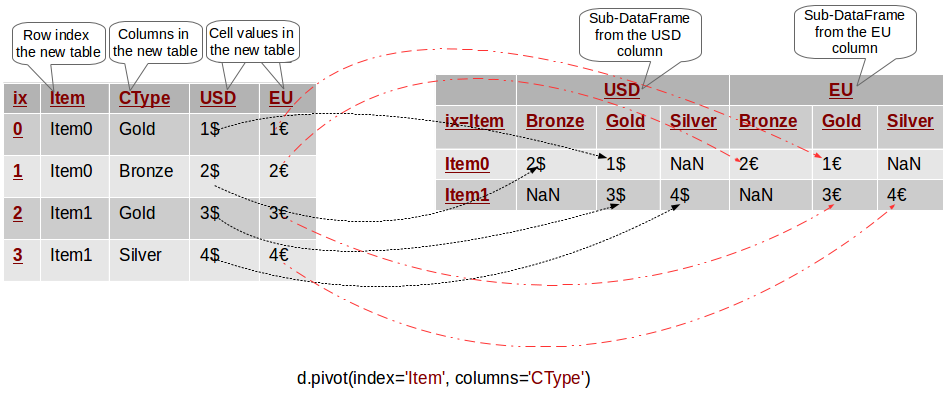
An example of multi-column pivoting (ref)
Make values in one columns be columns in a new "pivot" table,[ref]
df = pd.DataFrame({'foo': ['one', 'one', 'one', 'two', 'two',
                           'two'],
                   'bar': ['A', 'B', 'C', 'A', 'B', 'C'],
                   'baz': [1, 2, 3, 4, 5, 6],
                   'zoo': ['x', 'y', 'z', 'q', 'w', 't']})

pivot_1 = df.pivot(index='foo', columns='bar', values='baz')
pivot_2 = df.pivot(index='foo', columns='bar')['baz']
pivot_3 = df.pivot(index='foo', columns='bar', values=['baz', 'zoo'])

display_side_by_side(df, pivot_1, pivot_2, pivot_3)| foo | bar | baz | zoo | |
|---|---|---|---|---|
| 0 | one | A | 1 | x |
| 1 | one | B | 2 | y |
| 2 | one | C | 3 | z |
| 3 | two | A | 4 | q |
| 4 | two | B | 5 | w |
| 5 | two | C | 6 | t |
| bar | A | B | C |
|---|---|---|---|
| foo | |||
| one | 1 | 2 | 3 |
| two | 4 | 5 | 6 |
| bar | A | B | C |
|---|---|---|---|
| foo | |||
| one | 1 | 2 | 3 |
| two | 4 | 5 | 6 |
| baz | zoo | |||||
|---|---|---|---|---|---|---|
| bar | A | B | C | A | B | C |
| foo | ||||||
| one | 1 | 2 | 3 | x | y | z |
| two | 4 | 5 | 6 | q | w | t |
For one who wanna know display_side_by_side, check this note.
Change shape of df with melt()
Contrary to pivot, we now want to transform several columns into values of a single column,[ref]
df = pd.DataFrame({'A': {0: 'a', 1: 'b', 2: 'c'},
                   'B': {0: 1, 1: 3, 2: 5},
                   'C': {0: 2, 1: 4, 2: 6}})

df1 = pd.melt(df, id_vars=['A'], value_vars=['B'])
df2 = pd.melt(df, id_vars=['A'], value_vars=['B', 'C'])

display_side_by_side(df, df1, df2)| A | B | C | |
|---|---|---|---|
| 0 | a | 1 | 2 |
| 1 | b | 3 | 4 |
| 2 | c | 5 | 6 |
| A | variable | value | |
|---|---|---|---|
| 0 | a | B | 1 |
| 1 | b | B | 3 |
| 2 | c | B | 5 |
| A | variable | value | |
|---|---|---|---|
| 0 | a | B | 1 |
| 1 | b | B | 3 |
| 2 | c | B | 5 |
| 3 | a | C | 2 |
| 4 | b | C | 4 |
| 5 | c | C | 6 |
References
- Data Cleaning and Analysis on Dataquest.
- Transforming data with pandas on Dataquest.
- pandas official -- Group By: split-apply-combine
💬 Comments