
In order to group points into clusters, we need to know about their distance between each other.
Intercluster & intracluster
- Intracluster distance: Distance between two point in the same cluster.
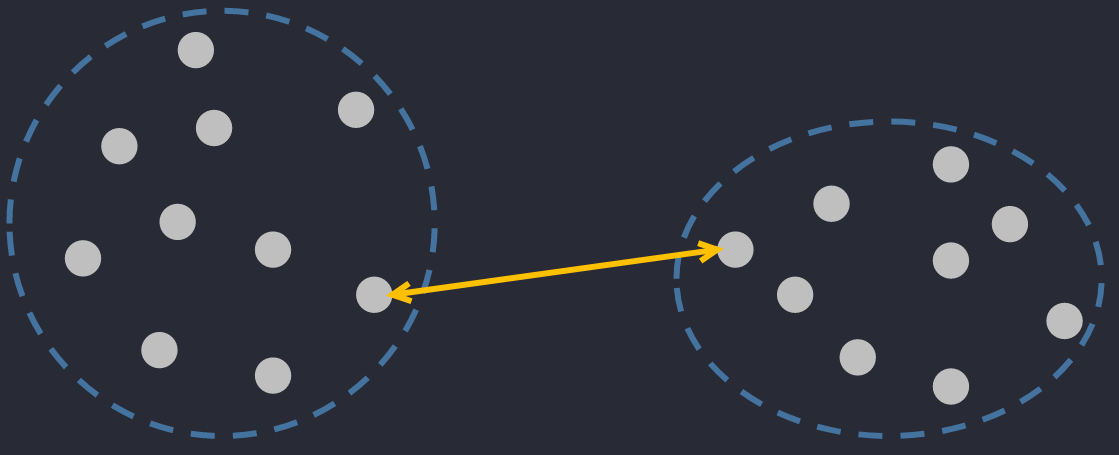
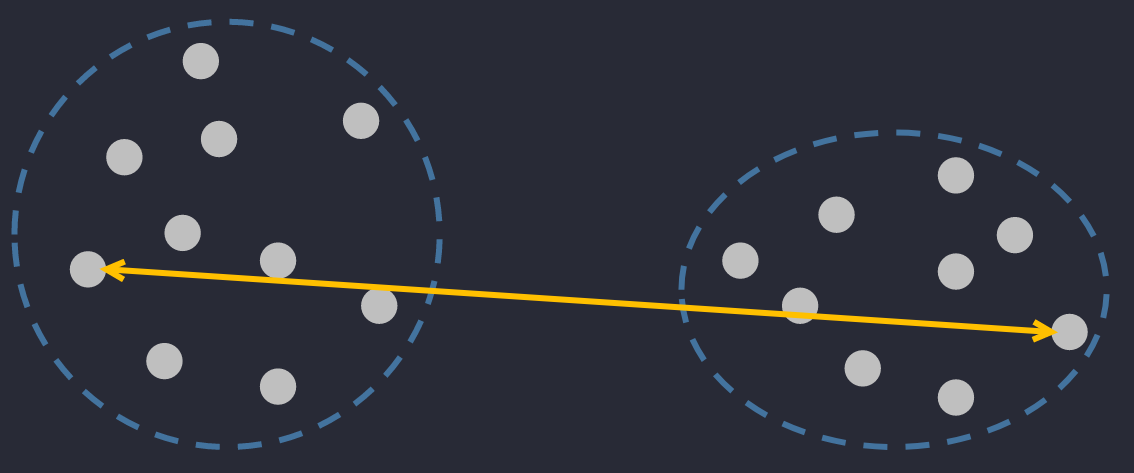
- Intercluster distance: Distance between two points in the different clusters.
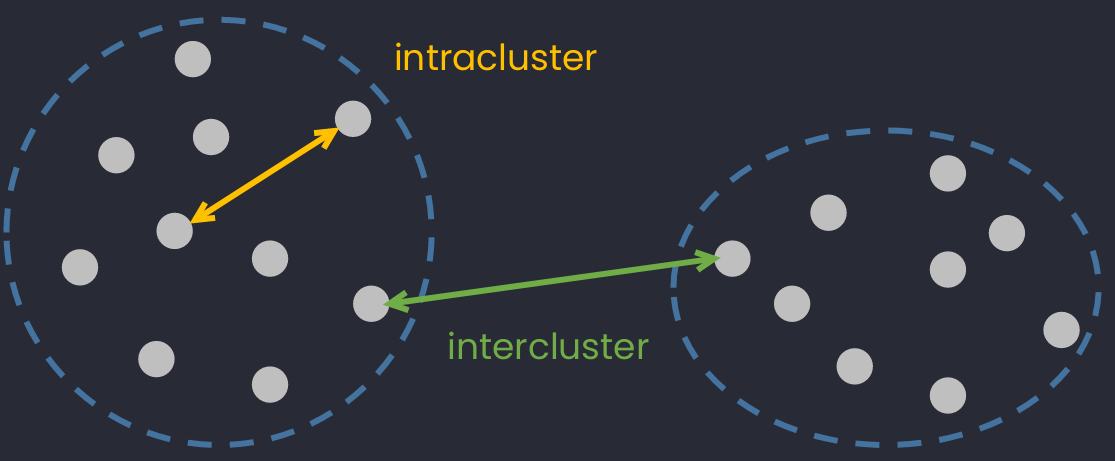
An illustraction of intercluster and intracluster distance.
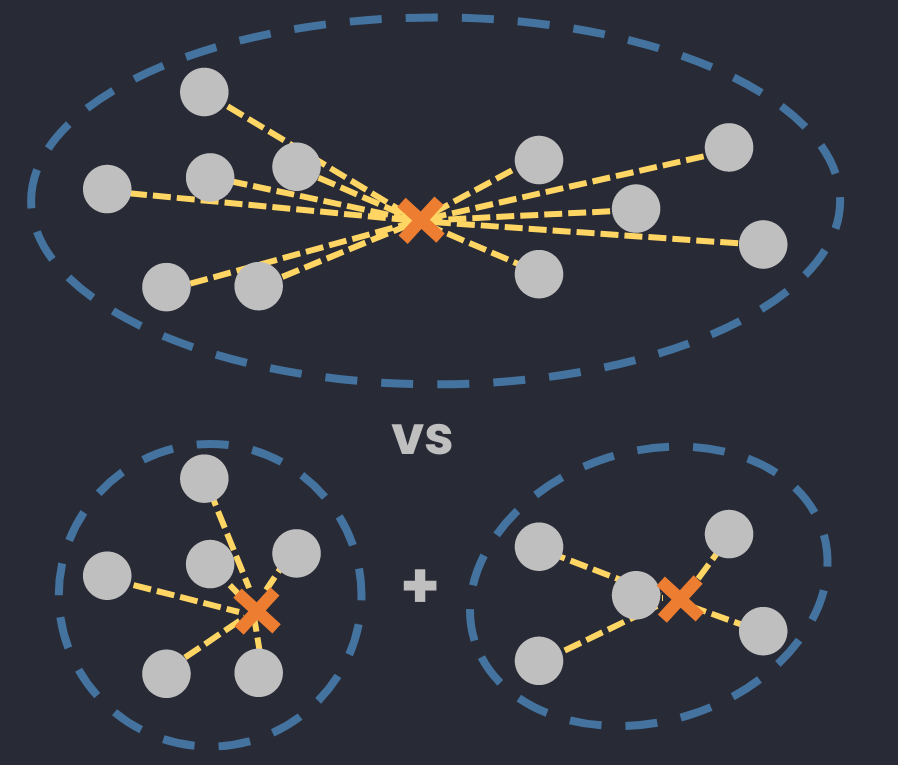
Best clustering min intracluster & max intercluster.
Distances used
Intracluster types
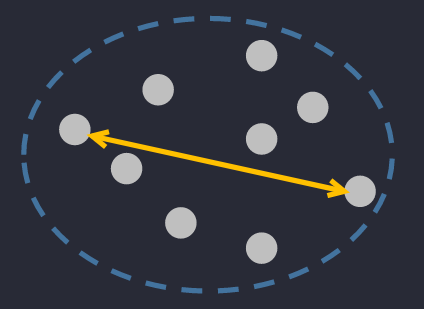
Intracluster -- Measuring distance between points in a cluster.
🔅 Complete Diameter Distance: the farthest distance between two points in a cluster.
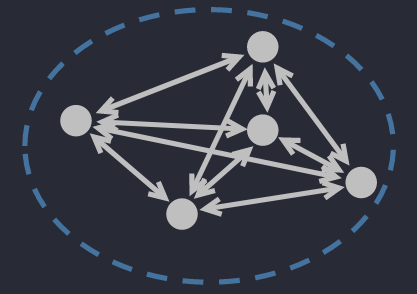
🔅 Average Diameter Distance: the average distance between ALL points in a clusters.
where is the number of points in .
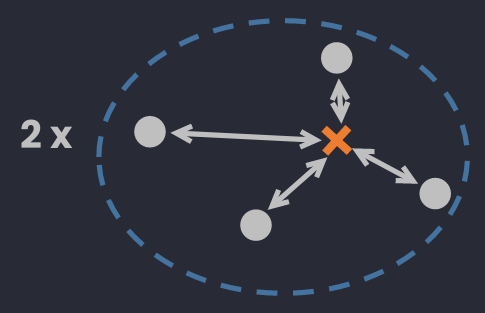
🔅 Centroid Diameter Distance: the double of average distance between points and the center of a cluster.
where (can be calculated as are the center and the number of points in .
Intercluster types
Intercluster -- Measuring distance between 2 clusters. They can be used in Agglomerative clustering.
🔅 Single Linkage Distance: the closest distance between two objects in 2 clusters.
🔅 Complete (maximum) Linkage Distance: the farthest distance between two objects in 2 clusters.
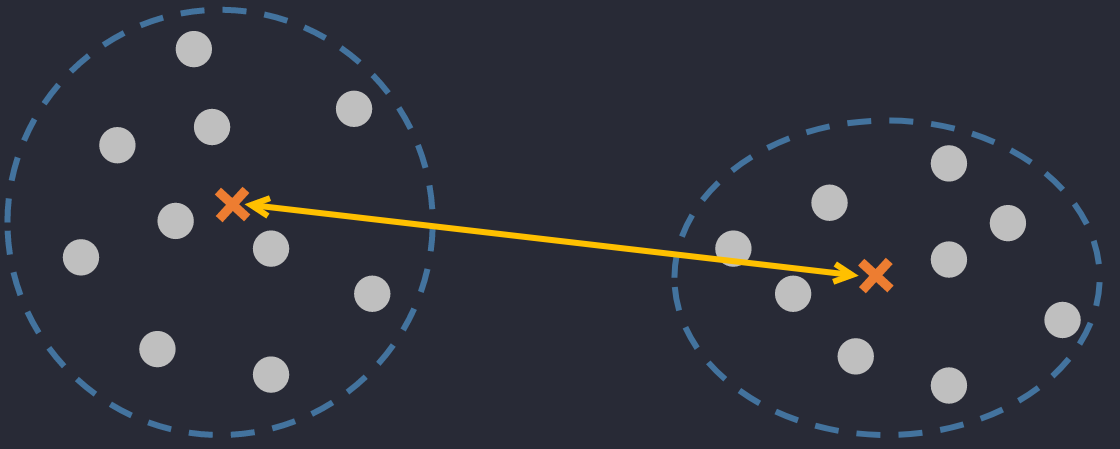
🔅 Centroid Linkage Distance: the distance between 2 centers of 2 clusters.
where are centers of . They can be calculated as and where is the number of elements in .
Don't be confused between these two. Center means the point in the interior of a circle that is equidistant from all points on the circumference, whereas centroid means the point at the centre of any shape.
🔅 Average Linkage Distance: the average distance between ALL objects in 2 clusters.
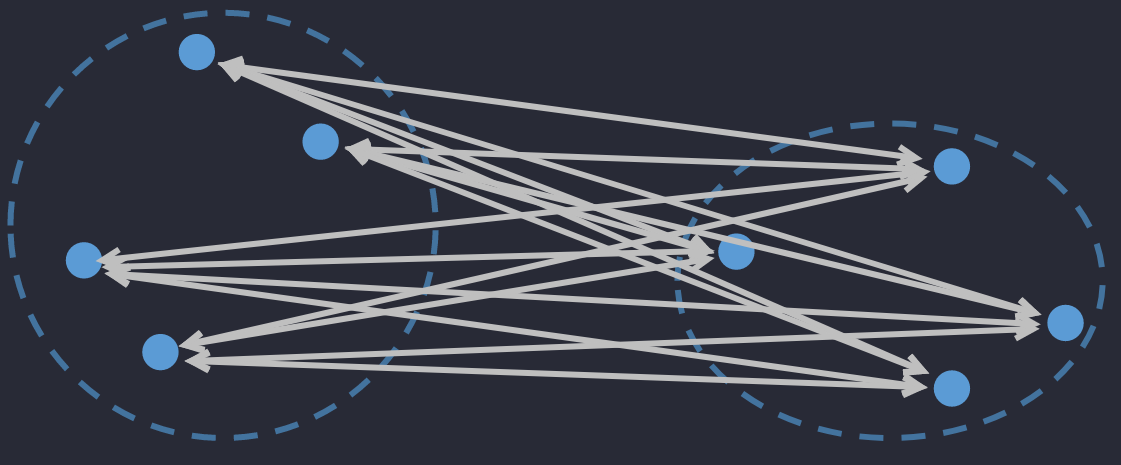
where is the number of elements in .
🔅 Ward's method (Minimum variance method): the different deviation between a group of 2 considered clusters and a "reputed" cluster joining those 2 clusters.
where are centers of and is the number of elements in .
Difference
👉 Different linkage type: Ward, complete, average, and single linkage
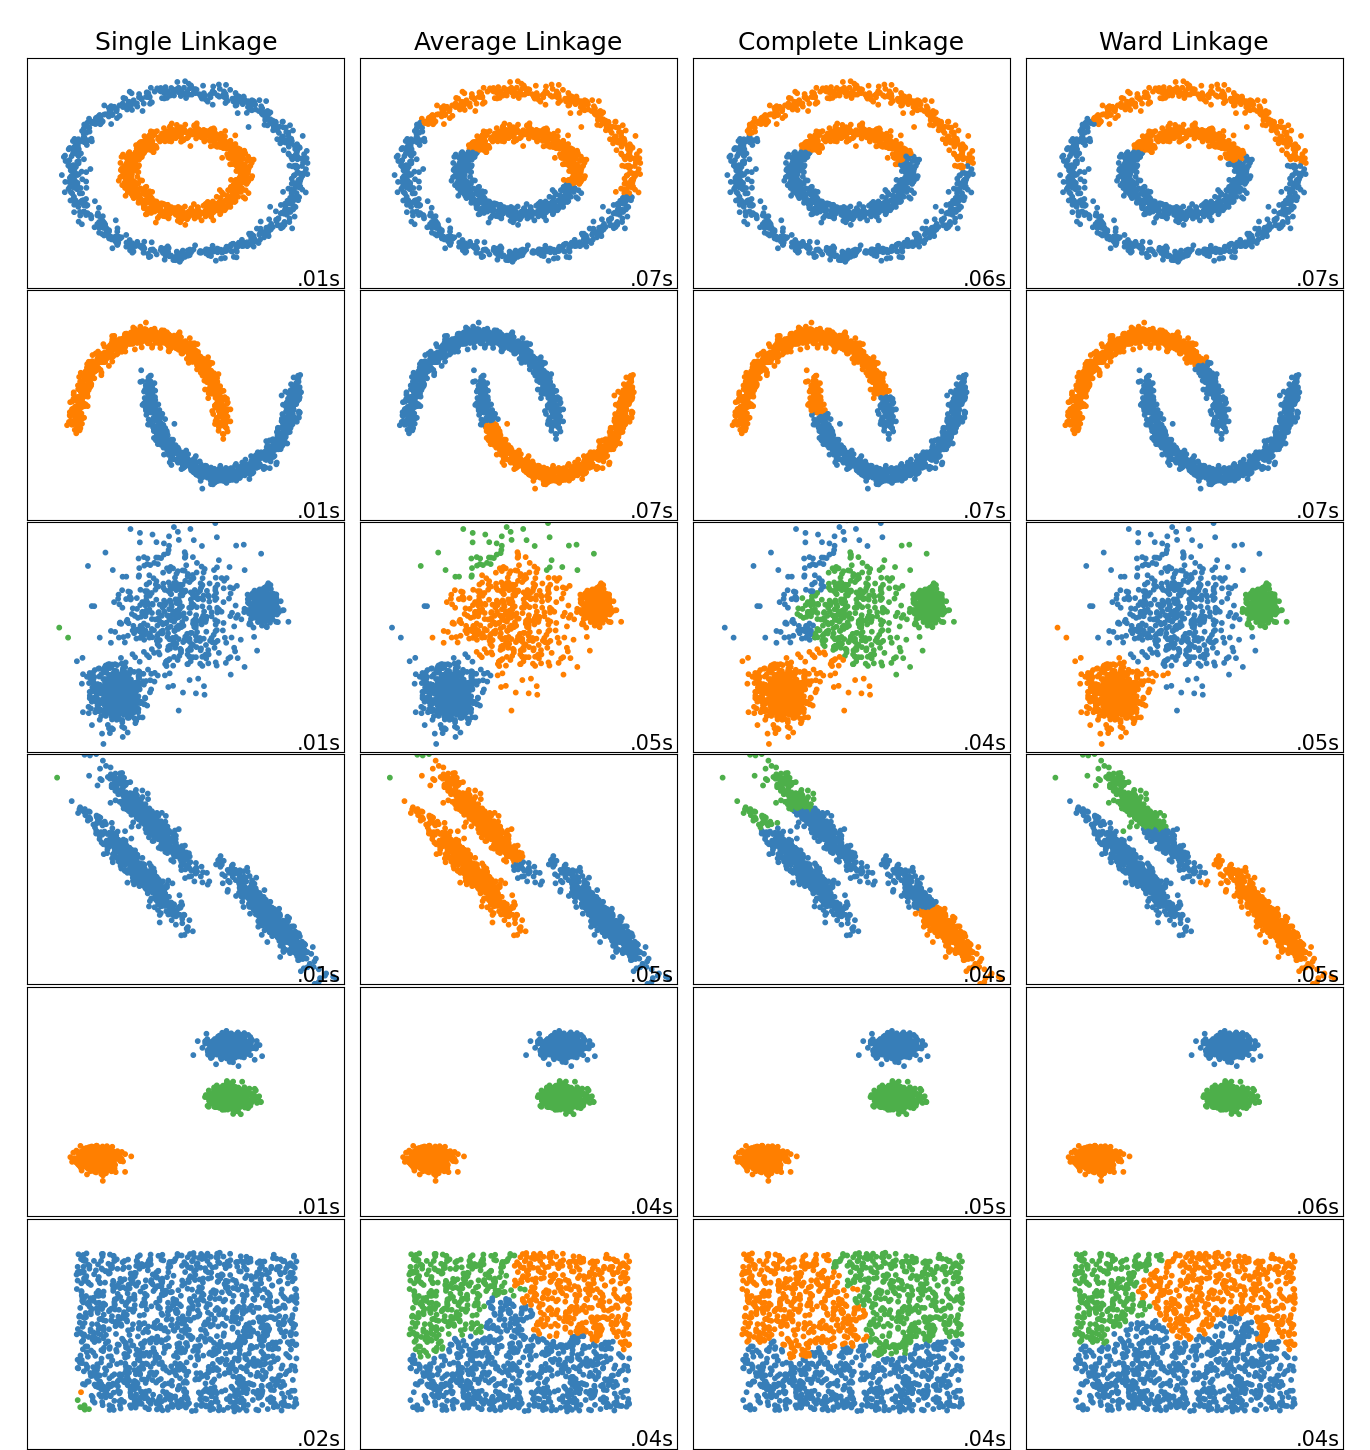
Different clustering results using different linkages on some special datasets. Source of image.
Code
Linkages can be called via linkage parameter from sklearn's AgglomerativeClustering
from sklearn.cluster import AgglomerativeClustering
clustering = AgglomerativeClustering(linkage="ward").fit(X)
# There are others: "ward" (default), "complete", "average", "single"
Silhouette analysis
Silhouette analysys (SA) is used to determine the degree of separation between clusters. It measure how close each point in one cluster is to points in the neighboring clusters and thus gives an idea of number of clusters visually.
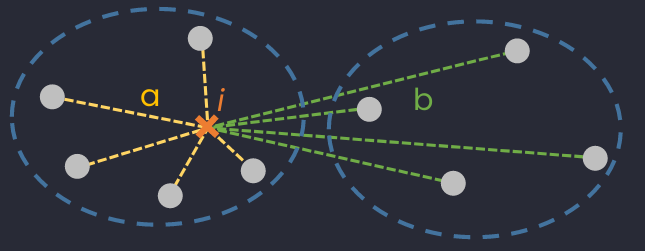
Illustration of mean intra-cluster distance (average distance between considered sample to all its neighboring in the same cluster) and nearest-cluster distance (average distance between considered sample to all samples in the closest cluster of its cluster).
- SA = +1 : a sample is far away from its neighboring clusters. (For clustering algorithm) Clusters are dense & well-separated.
- SA = 0 : a sample is near decision boundary. (For clustering algorithm) There are overlapped clusters.
- SA = -1 : a sample is assigned to a wrong cluster.
Used for?
- Better than Elbow method to find the number of clusters.[ref]
- Check if a clustering algorithm is well performed.
- Can be used to find outliers (-1 scores)
Silhouette plot
👉 Selecting the number of clusters with silhouette analysis on KMeans clustering
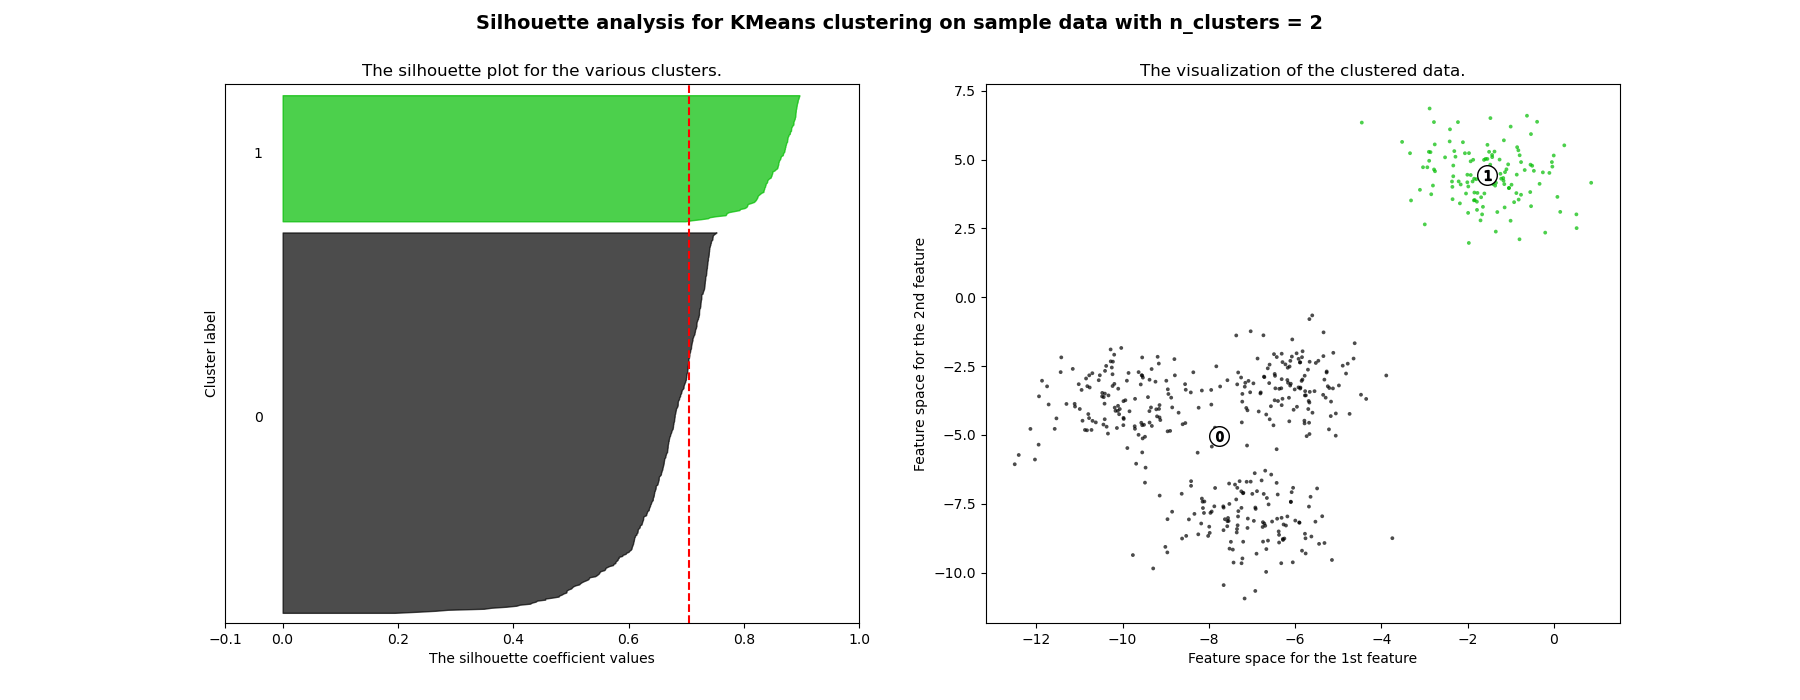
Silhouette plot with n_clusters=2. : all samples in the dataset sorted in a given cluster. : The Silhouette scores w.r.t. these samples. The red dotted line is the mean .
What we wanna see for a good number of clusters?
- Red dotted lines approaches 1.
- Plot of each cluster should be above red dotted line as much as possible.
- The width of plot of each cluster should be as uniform as possible.
from yellowbrick.cluster import SilhouetteVisualizer

model = KMeans(5, random_state=42)
visualizer = SilhouetteVisualizer(model, colors='yellowbrick')

visualizer.fit(X)        # Fit the data to the visualizer
visualizer.show()        # Finalize and render the figure
For original scikit-learn's functions, check this example.
Code
👉 Ref to silhouette_score, silhouette_samples.
# MEAN Silhouette Coefficient over all samples
from sklearn.metrics import silhouette_score
silhouette_score(X, labels)
# Silhouette Coefficient of EACH SAMPLE
from sklearn.metrics import silhouette_samples
scores = silhouette_samples(X, cluster_labels)
for i in range(n_clusters):
ith_cluster_silhouette_values = scores[cluster_labels == i]
💬 Comments